2021.02.19
마이크론은 2월20일 아침 끝난 미국장에서 전일대비 2.74% 상승한 90.96달러로 마감하면서
20년내 사상 최고가를 갱신하면서 20년전인 2000년8월 최고가 97.50달러에 근접하고 있다.
목요일 다이와 증권은 마이크론의 목표가를 140달러로 설정했는데 이는 비현실적인 주가는 아니다.
이전 상승 사이클인 2018년 당시 마이크론의 최고가는 64.66달러인대 이 당시 주당순이익은 12.47달러(희석식 11.5달러)로 PER는 6배 수준에 불과하였다.
마이크론의 목표가 140달러를 달성하려면 주당순이익은 20달러 이상이 필요하고 이는 달성 가능하다고 본다.
마이크론이 2000년8월 최고가를 갱신한다면 새로운 주가 시대가 열릴 것이다.
한국의 하이닉스도 새로운 주가 시대를 경험할 것이다.
참고로 키움증권은 2021년2월15일 발간한 리포트에서 2022년 하이닉스의 순이익을 22조3910억원(주당순이익 31,443원)으로 추정하면서 목표가 17만원으로 설정.
아래는 마이크론의 월봉 그래프.

---------------------------------------------------------------
2021.02.19
Micron Technology: The Stock Is Poised To Break Out Of A 20-Year Base
마이크론은 20년전 고점을 뚫으려 하고있다.
Micron Technology: Poised To Break Out Of A 20-Year Base (NASDAQ:MU) | Seeking Alpha
Summary
- Wait to see how the stock acts around the August 2000 high of $97.
- Capex can still exceed cash flow for Micron, in the last 10 years, but the cycles have been shorter and capital management better.
- Peak EPS last cycle for Micron was $12.47 per share in Nov '18 when MU was trading near $60, and at a 6x multiple.
- To hit Daiwa's $140 price target set Thursday, MU would need to generate at least $20 in EPS (not unthinkable).
Although primarily a fundamental investor, occasionally a review is started with a long-term chart.
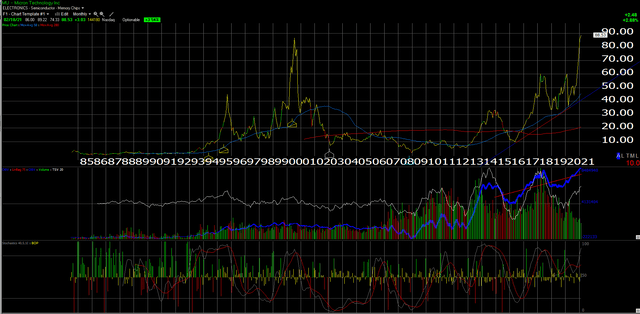
This monthly Micron (NASDAQ:MU) chart from Telechart Gold shows that Micron is on the verge of a 20-year breakout in the stock, after remarkable heights in 2000 and then plumbing remarkable depths in 2002, 2008 and then again in 2016.
The early August 2000, high was $97.50, with Micron closing Thursday, February 18, 2021, at $88.53.
The flipside to this chart is that the stock is headed for a 20-year "double-top" in the high $90s and maybe it's time to sell the commodity DRAM and NAND producer.
August 2000 was the height of the semiconductor fever for the Tech bubble and the large-cap growth rally of the late 1990s. That summer a Smith Barney sell-side analyst by the name of Jonathan Joseph came out with a "sell" on the semiconductor sector and the word is he got death threats and a lot of vile invective thrown his way.
I was writing for Jim Cramer's TheStreet.com at the time (now known as TheStreet) and Jim wrote an article at the time on his column entitled, "Being Right for the Right Reasons" which can't be found today, but Jim was supportive of the sector downgrade (as I recall) but there was still a lot of optimism around the sector even after all this.
In hindsight, Smith Barney's Joseph was right and Micron's stock has yet - until recently - come close to that summer of 2000 peak.
Today, Micron is a very different company than back in the 2000s, helped by the diversification of the core business away from just DRAM, and more towards NAND, but also thanks to Sanjay Mehrotra the former CEO of SanDisk that is now running Micron.
SanDisk had similar cycles to DRAM companies like Micron, but Mehrotra has brought more capital discipline to the company since being appointed CEO in August 2017. For those of us who have modeled the company since the late 1990s, Micron has actually repurchased stock and paid a dividend in the last 3 years, although it's not doing either currently, which should tell investors that Micron has not completely shed its "airline with a fab attached" roots.
The "airline with a fab attached" moniker came from an anonymous hedge fund manager in the late 1990s and all that means (in English) for the regular Seeking Alpha reader is that the old Micron went long periods where its capex requirement exceeded its net income and free-cash-flow, hence - over long periods of time - destroying shareholder capital (like many airlines did during the 1980s and 1990s).
In terms of capital discipline and shareholder capital treatment, Micron in general is doing far better today than in the 2000s.
In this article last summer - June 2020 - it was easy to turn more bullish on Micron since the DRAM giant's margins had started to stabilize.
Here is Micron's margin history

Source: internal valuation spreadsheet
Readers can see where the margins bottomed in early 2020 and even despite the pandemic and its convulsions, the steady improvement throughout 2020 showed that the bottom was in for the latest cycle.
Let's look at cash flow
For readers who want a concrete example of how cyclical Micron's business can experience - for short periods anyway - capex in excess of cash flow from operations, check this chart:
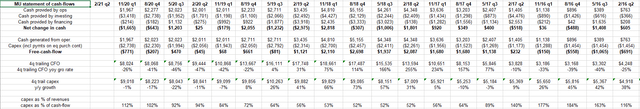
Source: internal valuation spreadsheet
Note the calculation at the bottom of the table: any number in excess of 100% means that capex for that quarter exceeded cash flow from ops for that quarter which is not usually a positive but since the 2000s this cycle has improved for Micron in that during the downturns the negative free cash flow lasts for quarters rather than years.
If I could expand the above cash-flow spreadsheet back to 2010, there have been several cycles but both the up cycles and down cycles typically have lasted 4-6 quarters and then we get "rinse, repeat."
What's "normalized EPS" for Micron?
On the attached spreadsheets above, which are much larger than what's shown here in the article 4-quarter or trailing-twelve-month (TTM) earnings per share (EPS) is tracked and if - using the Excel paint function and looking back to 2013 or longer - the "average" EPS for Micron over the 32 quarters is $3.89 per share.
The next question is what could be the "peak EPS" for Micron for the next cycle which looks like it has already begun.
Peak TTM EPS which we last saw in late-2018 was in the $12 per share area.
Daiwa Securities came out Thursday and issued a buy on Micron and a $140 price target.
2018년 주당순이익은 12달러 수준이었다.
다이와 증권은 2월18일 마이크론 목표가를 140달러로 설정.
When MU saw a $12.47 TTM EPS, it was peaking near $60 per share in the summer of '18 and trading near 6x earnings.
For Micron to hit $140 per share at 6x EPS it would need at least $23 per share or at least above $20 in EPS (accounting for some multiple expansion), which wouldn't be impossible for MU, but we would need another up cycle in pricing DRAM and NAND similar to the last upcycle in which TTM EPS went from $0.06 per share in August 2016 to $12.47 per share by November '18.
마이크론은 지난 상승 사이클에서 2016년 주당 순이익이 0.06달러에서 2018년 12.47달러로 급증한 역사가 있다.
Micron's forward EPS curve

Source: internal valuation spreadsheet
This table always throws readers for a loop for a minute but what I'm attempting to show mathematically is what Micron's "forward earnings" look like 4 quarters forward.
The black numbers at the bottom are the new estimates after the last earnings report and they all show higher estimates than the quarter before, meaning that in the 90 days after the previous earnings report before December/January's release, EPS estimates continue to rise and rose again after the last earnings report.
Fiscal 2022 and 2023 show the chronology of estimates. The $6.21 shows the sum of the quarterly estimates from Q3 '21 through Q2 '22, etc.
A little confusing but I think most readers will get the objective. Instead of showing just the fiscal year estimates, this attempts to ploy a forward earnings curve for the non year-end quarters, so readers can see the progression.
Summary/Conclusion
Micron has always had a bit of a cult following and the bulls can get rather nasty, but the down cycles have gotten better around the stock, and Sanjay Mehrotra has instituted some capital discipline, as much as he can anyway.
For Micron, the period from 2000 to 2010 was akin to a nuclear winter, and looking at the first chart, the decade's returns were ugly.
Investors are in the middle of the 3rd upcycle for this decade, while there were two huge upcycles during the 1990s.
The Daiwa upgrade today piqued my interest and I wanted to take the readers through the math and the capex/cash flow history of Micron to give readers some idea of what they are dealing with in terms of the stock.
Given the continued strength in semis through 2020, the pandemic and then currently, the probability is Micron breaks out above the 2000 high of $97.50.
My goal is to trade it for clients and not own it forever. As good a job as Sanjay Mehrotra has done with capital discipline and cycle management, the periods where capex exceeds cash from ops are probably not going away.
Clients owned a larger position in the stock off the 2016 lows near $10 per share but the position was sold in the high $20s. The stock has always been more of a trading vehicle than a longer-term position.
'반도체-삼성전자-하이닉스-마이크론' 카테고리의 다른 글
| 2021년 서버 디램 계약 가격 40% 이상 상승할 것(2021.02.25) (0) | 2021.02.25 |
|---|---|
| SK하이닉스 목표가 17만원-키움증권(2021.02.15) (0) | 2021.02.20 |
| 삼성전자, 하이닉스는 현재 기간 조정 중-->하락시 매수(2021.02.18) (1) | 2021.02.18 |
| 일본 자동차 반도체업체 지진으로 조업 중단(2021.02.15) (0) | 2021.02.15 |
| 디램 가격에 이어 낸드 가격도 상승할 것-모건스탠리(2021.02.11) (0) | 2021.02.12 |

