2022.04.29
Micron Technology Is An Undervalued Bet On Digital (NASDAQ:MU) | Seeking Alpha
Summary
- The share of Memory and Storage has increased from 20% of the semiconductor market in CY15
- to 30% in CY21.
- 글로벌 반도체 매출에서 메모리(디램)와 스토리지(낸드)가 차지하는 비중은 2015년 20%에서
- 2021년 30%로 증가하였다.
- Supply discipline will lead to slowing of Moore's law, which augurs well for this industry.
- 공급 억제는 무어의 법칙을 늦추게 될것이고, 이것은 반도체 산업에는 좋은 징조이다.
- Micron is uniquely placed to gain from data center expansion, cloud adoption, move to 5G, AI growth, EVs, and the transition from HDD to SSD.
- 마이크론은 데이터 센터 확장, 클라우드 채택, 5G로의 전환, AI 성장, 전기차및 HDD에서 SSD로의 전환에서
- 이익을 얻을 수있는 독보적 인 위치에 있습니다.
- After factoring in cyclicity risks, we find that the MU stock undervalued by over 20%.
- 호황과 불황이 반복되는 위험을 고려한 결과, MU 주식이 20 % 이상 저평가되었음을 알 수 있습니다.
Investment Thesis
Memory (DRAM) and Storage (NAND) share in the semiconductor market has been increasing – 30% of semiconductor market in CY21 from 20% in CY15. Supply discipline in the industry will lead to slowing of Moore's law and market share retention.
글로벌 반도체 매출에서 메모리(디램)와 스토리지(낸드)가 차지하는 비중은 2015년 20%에서
2021년 30%로 증가하였다.
공급 억제는 무어의 법칙을 늦추게 될것이 시장 점유율은 보존될 것이다.
Micron Technology (NASDAQ:MU) - revenue market share of 23% in memory and 11% in storage as of CY21 - is uniquely placed to gain from data center expansion, cloud adoption, move to 5G, AI/ML growth, EVs, and transition from HDD to SSD.
마이크론은 2021년 글로벌 디램 매출의 23%, 낸드 매출의11%를 차지했다.
마이크론은 데이터 센터 확장, 클라우드 채택, 5G로의 전환, AI 성장, 전기차및 HDD에서 SSD로의 전환에서
이익을 얻을 수있는 독보적 인 위치에 있습니다.
Memory and Storage products are central to these major trends and are ubiquitous to all things digital (in the end market demand section, we have projected the DRAM growth from key end markets). After factoring in cyclicity risks with this business, we find that MU’s equity is worth $95M (intrinsic share value of $85) i.e., it is undervalued by 21% (as of 4/18/22). If you are looking for an undervalued growth company that is a bet on digital, then Micron is a company we recommend that you consider in your portfolio.
Company Description
Micron Technology was founded in Boise, Idaho, in 1978. The company develops memory (DRAM) and storage (NAND) solutions for data center, enterprise, PC, mobile, auto, industrial and consumer end markets.
MU derives ~74% revenue from DRAM and ~23% from NAND. DRAM has a gross margin ~2x that of NAND.
75% of MU’s revenue comes from volume-based long-term agreements, a significant increase from five years ago when they accounted for around 10% of revenue.
마이크론의 매출중 디램이 74% 낸드가 23% 차지한다. 디램의 이익은 낸드의 2배가 된다.
마이크론 매출중 수량 기준의 장기 계약이 75%를 차지하는데, 이는 5년전의 10%보다 크게 증가한 것이다.
Korea based Samsung and SK Hynix are MU's two major competitors in the memory space.
MU has a DRAM revenue market share of 23%, Samsung 43% and SK Hynix 28%.
글로벌 디램 매출 점유율은 삼성이 43%, 하이닉스가 28%, 마이크론이 23%이다.
It competes with Samsung, SK Hynix, Western Digital (WDC) and Kioxia (formerly Toshiba) in the storage space. Samsung has the largest revenue share of this market as well at 34%, Kioxia 19%, WDC 15%, SK Hynix 19%, followed by MU at 11%.
글로벌 낸드 매출 점유율은 삼성이 34%, 키옥시아 19%, 웨스턴디지털 19%, 하이닉스 19%, 마이크론이 11%이다.
In the subsequent sections, we will present a deep dive into the industry, end-market demand drivers,
bottom-up projections, company performance, valuation (intrinsic and market pricing), and risks.
Industry
This industry is cyclical since memory and storage are commodities i.e.,
their prices are governed by demand and supply.
There are boom and bust cycles and its important that investors look through cycles and
not focus on one year of boom or bust alone.
We cover product pricing that leads to cyclicity in the pricing subsection.
But first, it is important that we get a high-level understanding of memory and storage.
반도체 산업은 메모리(디램)와 스토리지(낸드)가 상품화된 이래 호황과 불황이 반복되는 산업이 됭었다.
디램과 낸드의 가격은 수요와 공급에 의해서 정해진다.
투자자들은 호황과 불황이 반복되는 것과 이것을 1년 동안이 아닌 주기 전체를 보는 것이 중요하다.
디램과 낸드에 관해 고차원의 이해가 필요하다.

Exhibit - 1: DRAM and NAND (Company Reports)
While Memory or DRAM is volatile (i.e., data is not retained when power is switched off),
Storage or NAND is persistent.
디램은 휘발성이나 낸드는 비휘발성이다.
The latest advancement in DRAM is 1-alpha process technology (that shrinks memory cell area, increases bit density, which allows to reduce costs) and upgrade to (DDR5), which provides higher bandwidth (along with higher memory density) at a lower power consumption than (DDR4).
Similarly, in NAND, the latest advancement is the stacking of more layers, which are smaller in size, but have higher speed and capacity than the earlier version. On the NAND side, there have been advancements in storage access and transfer protocols (NVMe – non-volatile memory express) for solid state storage.
Product Pricing

Exhibit – 2: DRAM price history (thememoryguy)
Advancements in DRAMs and NANDs are linked to Moore’s law i.e., their prices fall even though quality improves overtime (There have been deviations in the past e.g., In the last decade, and specifically between 2011 and 2014, DRAM prices didn’t follow a downward trajectory).
Average Selling Prices (ASP) for DRAM are ~$4 / GB as of 2021-22.
Typically, ASP for new advancements are higher than prior versions e.g., ASP for DDR5 DRAM is 30% higher than DDR4 and it is expected that this premium will dissipate over time.

Exhibit – 3: MU commentary on supply growth (Company Reports)
When memory and storage manufacturers oversupply to gain market share, they not only hurt their competitors, but also hurt themselves since prices fall, which adversely impact their sales, profitability and share price. Over the last few years, companies in this space are following supply discipline to counter price fall - i.e., they are trying to grow with the market demand growth (instead of outstripping demand).
Conversely, when there is a component shortage, prices flatten or rise. This acts as very temporary gain, before affecting product development and shipments.
In the below chart, we have illustrated the cyclical nature of business as prices (specifically DRAM prices) rise and fall.
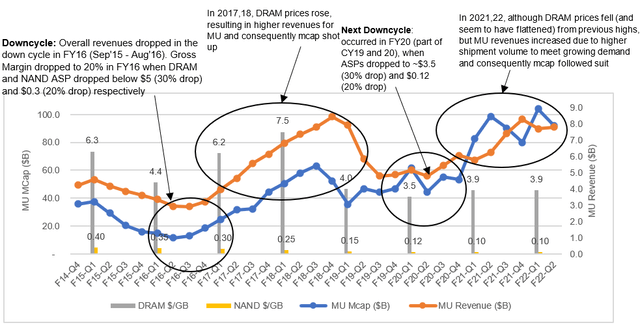
Exhibit – 4: Cyclical business (MU) (Author)
End-Market Demand
As of CY20, DRAM and NAND revenue constituted 30% of Semiconductor market from 20% in CY15. This growth is driven by increasing memory and storage demand in data centers (owing to server CPU architectural shifts, cloud adoption, AI and ML data intensive workloads), mobile, PC OEMs, consumer, and new developing market – automotive.
Below we have provided the demand drivers in key end markets. We have also provided underlying modeling details on our 3- and 5-year DRAM volume (or bit shipment) demand projections for the key end-markets.
Please note that we have not made revenue projections beyond year-3 i.e., CY24 (despite secular demand drivers expected to continue beyond year-3) since prices are very volatile owing to business cyclicality. In fact, to factor in cyclicality, we have assumed the DRAM average price declines by ~35% in year 3, which is equal to the average annual historical decline in a down cycle. Having said that we are not letting a down cycle completely impact our fair value of this business since we are using normalized Free Cash Flow estimates that averages out the impact of a good and bad year. More details and rationale presented in the valuation section of this report. Also, note we have assumed NAND prices to decline sequentially in line with history amidst intense competition.
DRAM demand by end-markets

Exhibit – 5: DRAM demand by end-markets (Author)
As per our end-market demand estimates (which we have detailed below), we expect Server CPU and Auto to be the fastest-growing markets. Server CPU and Mobile combined will account for 60% of DRAM demand.
Server CPUs in Data Center and Enterprises
Data centers are going to drive over 30% of the memory demand by CY24 from 20% today.
CPU processors (produced by INTC, AMD and Ampere) in cloud and on-premise servers require memory and storage, which constitute 40% of server bill-of-materials cost.
There are 5 key factors that are driving increasing DRAM demand in server CPUs:
- adoption of new CPUs from Intel – Ice Lake/Sapphire Rapids and AMD EPYC – Milan/Genoa (new CPUs come packed with PCIe 4.0/5.0, which have much higher data transfer speeds – ideal for data intensive workloads – from PCIe 3.0)
- higher DRAM content per new server CPU listed in 1 above. These chipsets have 8 (Genoa has 10) memory channels vis-à-vis earlier generations, which had 6. Each memory channel has 2 memory slots or DIMMs, each of which can hold 32/64 GB DRAM memory sticks, which again are of higher capacity than earlier generations.
- increasing cloud adoption, which have higher memory utilization levels than enterprise on-premise servers
- increasing AI/ML workloads, which require 6x more DRAM versus a standard CPU server
- upgrade of DDR4 to DDR5 RAM, which is faster and priced at a premium (PCI 4.0 and 5.0 support DDR5)

Exhibit - 6: Server DRAM Demand (Author)
As per our projection (refer exhibit – 6), which considers all the above 5 factors, we expect the server CPU DRAM demand to grow at ~30% over the next 3- and 5-year periods. However, in terms of revenue, this demand growth translates to 21% growth for MU over the next 3 years since we have assumed a DRAM ASP/GB decline of ~35% in year 3, which is equal to the historical annual decline % in a down-cycle.
We expect that Server CPU NAND will grow at 25% over the next 3 years, in line with industry estimates.
PC OEMs
PCs are going to contribute a little over 20% of the memory demand by CY24 from ~25% today.
Low-power DRAM (LPDRAM) has grown to 20% of the PC industry DRAM bit demand today and is projected to become most of the PC market in five years. Pre-COVID, PC volume sales had softened to annual 260 M globally. COVID acted as a tailwind, which resulted in PC volume sales reaching 340 M units in CY21. In CY22, PC sales are sluggish again due to unavailability of non-memory components. As non-memory components become available, there will be a pent-up demand for PCs (and memory and storage) in H2 of CY22 and beyond. However, it is expected that over the next 5 years, PC volume sales will grow at only 2%, but memory content per PC unit will grow faster from average 9GB to 14GB DRAM. Similarly, tablets are expected to witness slowing growth with average DRAM content per tablet to rise from 3 GB to 3.8 GB. We have projected PC (including tablets and gaming consoles) DRAM to grow at ~13% next 3- and 5-year period (refer exhibit – 7 below). We expect PC NAND to grow at 18% over this period. Both estimates are in line with industry.

Exhibit – 7: PC DRAM Demand (Author)
Mobile
Memory demand from Mobile will drop below 30% by CY24.
Per IDC, mobile shipments will grow from 1,350 M in CY21 to over 1,500 M in 5 years. Moreover, 80% of shipments will be 5G by CY26 from 35% in CY21. As per Micron’s earning call transcripts and industry estimates, DRAM content in 5G phones is 50% higher and NAND content is almost 100% higher than in 4G phones. Based on these estimates, we have projected mobile DRAM demand to grow at 11-14% over 3- and 5-year periods (refer exhibit – 8 below); and mobile NAND to grow at 25% in the same period.

Exhibit – 8: Mobile DRAM Demand (Author)
Auto
Automobile contribution to memory will witness the fastest growth, although absolute contribution will remain small.
6.8 M EV cars were sold in CY21. (Micron is the top supplier to automotive industry with a 40%+ global market share. This means that it supplied to ~3 M EVs in CY21). As per UBS Investment Bank, 20% of all cars sold in 5 years will be electric. This translates to over 20M EV cars.
In Micron’s last two earnings calls, CEO Sanjay Malhotra mentioned that some of the Level 3 autonomous EVs have about $750 in memory and storage content, which is 15x higher than the average car; these EVs use 140GB of DRAM and 1TB of NAND. An average EV car consumes $50, which is ~$38 (or ~8GB) worth of DRAM and ~$12 (or ~120GB) worth of NAND.
Based on our projections, memory, and storage worth $50 / EV on an average could rise to $250 / EV by CY26 at constant prices. This is a CAGR of 38%.

Exhibit – 9: Auto DRAM Demand (Author)
As per above projections, total DRAM demand from all the end-markets will grow at 18% over the next 3 years, which is in line with the industry growth guidance.
Financial Performance and Valuation
Gross Margin dropped to 20% in FY16 when DRAM and NAND ASP dropped below $5 (30% drop) and $0.3 (20% drop) respectively. Next downcycle occurred in FY20 (part of CY19 and 20), when ASPs dropped to ~$3.5 (30% drop) and $0.12 (20% drop).
Revenue for CY22-24 has been modeled assuming MU can retain its current market share across both DRAM and NAND end-markets (refer End-Market Demand section). Revenue falls in CY24 due to assumed price decline (to bake in the cyclicity). Please note that we cannot really predict the next downcycle, which may occur at any other time and may be less impactful if Moore's law slows down and companies maintain supply discipline. We are factoring in cyclicity in our projection. (Refer exhibit 4, 13 and 14 for details).
P&L – History and projection

Exhibit – 10: P&L history and projections (Author)
DRAM and NAND revenue and GM projection

Exhibit – 11: DRAM and NAND projections (Author)
DRAM makes up more than 70% of revenues and has considerably higher gross margin than NAND. Please refer end-market demand section for DRAM breakdown by end-markets.

Exhibit – 12: Balance Sheet history and projections (Author)
Cash flow projection and intrinsic valuation
We have estimated the fair equity value to be ~$95B ($85 / share) using normalized - i.e., 4-year average FCF to bake in the impact of cyclicity (Company reports 4-year FCF as well).
Moreover, CY24 FCF is negative since we have assumed DRAM prices will fall by the historical annual % during a down cycle. Since we are using 4-year average FCF, the avg FCF reduces to ~$3.9B in CY24 from ~$4.7B in CY23.

Exhibit – 13: Cash Flow Projection and Intrinsic Valuation (Author)
As we outlined earlier, an investor needs to analyze this business by looking at it across cycles and not focus on a good or bad year alone. Had we not factored in price decline and not used normalized FCF then we would end up with a significantly higher value for the business, with the implicit assumption that the business is not cyclical anymore (which wouldn’t have been accurate).

Exhibit – 14: 4-year FCF (Author)
Moore’s law may very well slow down, and companies may follow supply discipline. If this happens then the business will be worth more.

Exhibit – 15: fair multiples (Author)
Our base case fair equity value estimate ($85 / share) is ~15% above the market value and this value factors in the risks with a cyclical business.

Exhibit – 16: share value range based on price changes (Author)
Our floor value or downside scenario is $75 / share (which is slightly above the trading price as on 4/14/22) and our bull case value is $97 / share (refer exhibit – 16).
Market Pricing
MU’s last 4-year (FY18-Q3 to FY22-Q2) average 1-yr forward EV/S and EV/EBITDA multiple is 2.4 and 4.7 respectively. Applying these multiples to CY23E sales and EBITDA of $38.8B and $20.2B, prices the enterprise value of the company at ~$91B (~$94B equity value or a share price of $84) and ~$95B (~$98B equity value or a share price of $88).
Peer Valuation
Korea based Samsung and SK Hynix are MU's two major competitors in the memory space. These three companies together account for ~95% for the memory market. Samsung has the largest revenue market share at 43%, SK Hynix 28% and MU 23%.
In the storage space, Samsung, SK Hynix and MU together account for ~65% for the market. Other major players are WDC and Kioxia. In this market as well, Samsung has the largest revenue share at 34%, Kioxia 19%, WDC 15%, SK Hynix 19%, followed by MU at 11%

Exhibit – 17: Peer-Set Metrics (Company Reports, Yahoo Finance)
In exhibit-17, we have not included Samsung since it operates in businesses other than memory and storage as well.
Besides Samsung, SK Hynix is the only peer company that operates solely in memory and storage. As per LTM numbers, SK Hynix has an overall margin, which is 2% points lower (than that of MU) owing to a larger NAND revenue component, which is less profitable than DRAM. As of this writing, SK Hynix is trading at an LTM EV/S and EV/EBITDA of 2.2 and 4.1 respectively, which is slightly lower than that of MU.
Risks
As already mentioned, cyclicality in this business is a function of supply and demand.
When there are shortages, it impacts the ability of companies in this space to meet demand. In Oct ’21, an earthquake in Taiwan, impacted MU’s DRAM production. In Feb ’22, a contamination in a Japanese plant hurt WD and Kioxia hurt their NAND output (which is expected to benefit MU and others over the short term). On the other hand, when companies oversupply, then it not only hurts their competitors, but also hurts them. Although, both the DRAM and NAND players are exercising supply discipline, but specifically, in the NAND side, investors are watching closely a new Chinese company YMTC. Although, the Chinese company needs to prove its products to the market, but there is a risk of this company disrupting the supply discipline.
On the demand side, despite secular end-market demand drivers, there are periods (short-term) of softened demand due to inflationary pressures, pull forward demand, and shortages of non-memory components, which leads to customer inventory buildup.
Conclusion
Memory and Storage are ubiquitous to all industries undergoing digital transformation. Then why is the market undervaluing growth?
Market seems to be undervaluing growth, primarily because the industry is cyclical - i.e., there are boom and bust cycles since prices of memory and storage are governed by demand and supply. SK Hynix and Samsung are the only other major players in both memory and storage space (of course, threat from much smaller and new Chinese entrants can’t be ignored). When these companies oversupply, prices fall and it not only hurts competition, but also hurts them. Companies in this space are now following supply discipline to counter price fall - i.e., they are trying to grow with the market demand growth (instead of outstripping demand).

MU Valuation Summary (Author)
After factoring in cyclicity risks with this business, as per our base case, MU’s equity is worth ~$95M (intrinsic share value of $85) i.e., it is undervalued by 21%.
'반도체-삼성전자-하이닉스-마이크론' 카테고리의 다른 글
| 다시 찾아온 메모리 전성시대…성장세 비메모리의 2배(2022.05.06) (0) | 2022.05.08 |
|---|---|
| 중요-반도체와 클라우드의 강세가 마이크론에 의미하는 것(2022.05.06) (0) | 2022.05.06 |
| 웨스턴디지털, 분기 호실적 발표(2022.04.29) (0) | 2022.04.30 |
| 서버 생산업체는 하반기 낙관적인 전망(2022.04.29) (0) | 2022.04.29 |
| 삼성전자, 중국 Lockdown 해제 → 메모리 개선 가속화(2022.04.29) (0) | 2022.04.29 |


